
Appropriate Analytics Dashboard Design is critical to the effectiveness of business insights offered to the audience. BI consumers, especially key executives need dashboards that convey the root cause of any occurrence or trend, at a glance.
GrayMatter’s UI strategy is based on the 4 Ws principle of What, Why, When and Where to enable the user to have the complete picture on any particular analysis. The dashboards are designed in such a manner that lead the user from one question to the next and by the end of the navigation the user has comprehensive information on the subject. The purpose is to enable the user to understand what the opportunity or issue is, where and when is the trend observed and why it is happening. Such thorough analysis leads to follow-up action to leverage the opportunity or address the root cause of the issue.
What are the 4W’s?
Let us breakdown the 4Ws and look at it in greater detail:
What?–You review your KPIs on a summary of Analytics Dashboard Design and get to see what is the opportunity or issue
Where? – After knowing what is the opportunity or issue you will need to know where it is occurring. GrayMatter’s dashboards allow the user to drill down from the summary dashboard to detailed Analytics Dashboard Design that shows the specific occurrence which may be a location, a business unit, a product category, or so many other possibilities
When? – After seeing what and where, one needs to know if this is a seasonal issue, or trend, or maybe just an exceptional incident? The user can analyze across time periods to investigate along these lines. Any action in response to the occurrence definitely needs to be different depending upon whether it’s a one-off incident or a repetitive trend
Why it is occurring?–After unearthing what, when and where, the user needs to know the root cause behind the opportunity or issue. GrayMatter’s dashboards offer multiple levels of drill-down to the lowest level of detail and enables the user to know the fundamental reason behind the occurrence
Sample Dashboard – 4Ws in Action
Appended below screenshots that depict how the GrayMatter summary dashboards and their drill-downs operate on the principle of 4Ws. These Analytics Dashboard Design are pertaining to sales at non-duty free stores in an airport. So what is happening here in these screenshots?
The first image shows “What” the problem is. The revenue has dipped with respect to last year and the planned numbers have also not been achieved. The user intuitively clicks on the line item “Revenue” and is navigated to the portlet showing details of revenue. One look at the portlet reveals that the issue is with sales at stores located in T1-Arrival and so that is “Where” the problem lies.
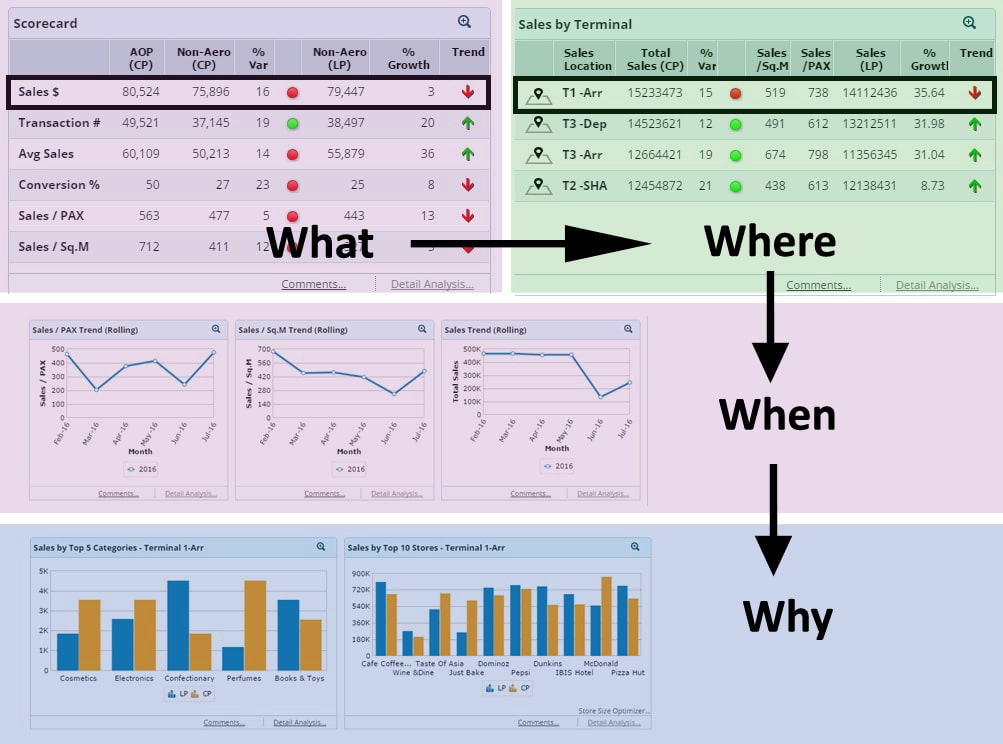
Analysis over time periods reveal the particular months when the revenues dipped. This ascertains as to “When” the problem occurred. A drill down to the root cause behind the issue shows the particular stores and product categories for which sales have reduced and that is the reason “Why” the overall problem has surfaced.